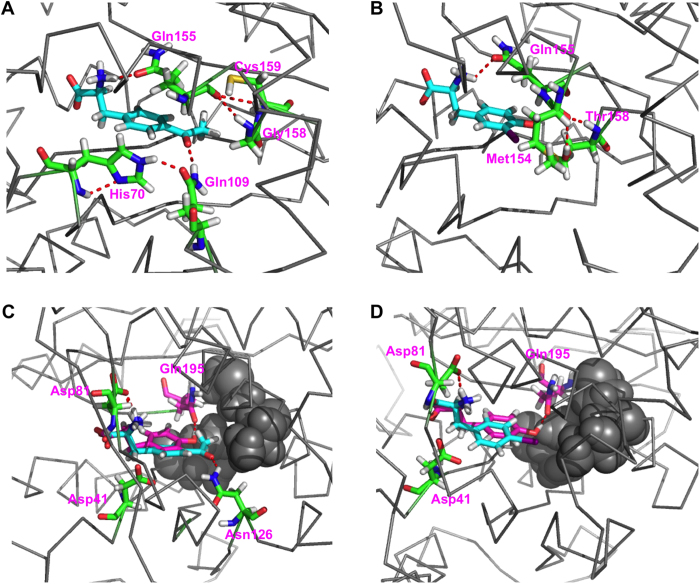
Figure 4. MD-averaged structures showing the active sites of the studied aaRSes and unAA complexes.
(A): MjAcFRS bound with AcF; (B): MjIoYRS bound with IoY; (C): EcPolyRS bound with AcF; and (D): EcPolyRS bound with IoF). Ligands are shown as cyan sticks. Residues important for substrate specificity are shown as green sticks. In panels C and D, Tyr ligands are shown as magenta sticks for comparison. Ile37, Ser182, and Met183 of EcPolyRS are shown as gray balls.

