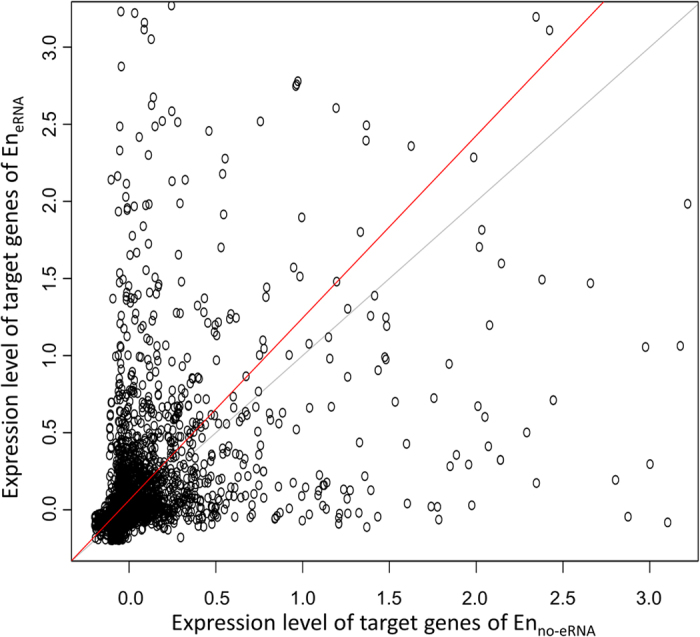
Figure 4. Expression level of the same target genes of the same positioned enhancers across tissues.

Z-scores of the BPKM were calculated for each tissue. Each dot represents the average expressions (z-scores) of the same gene targeted by the same positioned EneRNA or Enno-eRNA (see Material and Methods). The red line is least rectangles regression. The grey line is a reference diagonal line with a slope of one. For presentation, the axes are limited to three times the standard deviation of the average z-scores.
