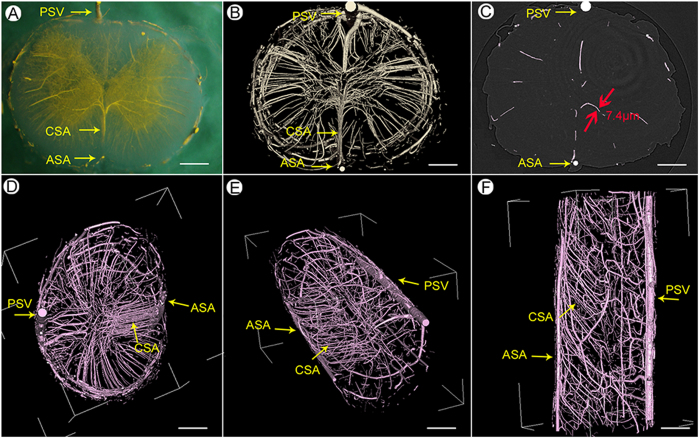
Figure 3. 3D image of spinal cord vascular morphology.
(A) The stereomicroscope image of the spinal cord. (B) SRμCT 3D image of spinal cord microvasculature. (C) Linear length measurements of vessels in the gray matter region of the spinal cord down to 7.4 μm. (D–F) An intact vasculature with pink pseudo-color to allow the viewing of different levels of vascular detail at the top (D), oblique (E), and sagittal (F) orientation. (PSV = posterior spinal vein; ASA = anterior spinal artery; CSA = central sulcal artery.) Bar = 200 μm.

