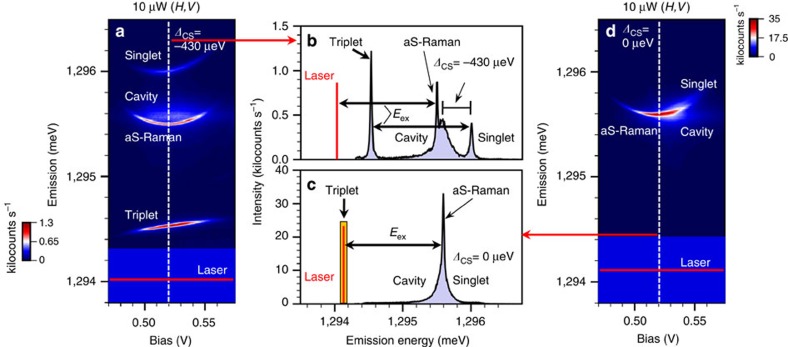
Figure 3. Bias-tunable QDM emission.
(a) Quasi-resonant bias map of the emission spectra from the singlet, triplet and cavity mode at a detuning of ΔCS=−430 μeV (sample temperature of 5 K). Strong, bias-tunable anti-Stokes Raman emission is also observed. (b) Emission spectrum extracted from the dashed line in a at 520 mV. (c) Emission spectrum extracted from d at the dashed line (520 mV) for the case where the cavity is brought into resonance with the singlet transition (ΔCS=0 μeV) by raising the sample temperature to 22 K and where the laser is resonant with the triplet. Laser scatter prohibits observation of the triplet transition and so we indicate its known energy with the orange rectangle. (d) Resonant bias map for a cavity-singlet detuning of ΔCS=0 μeV. The polarization configuration is (laser, detection)=(H,V) for all spectra in this figure. The intensity in a,d is plotted on a linear scale in kilocounts s−1.

