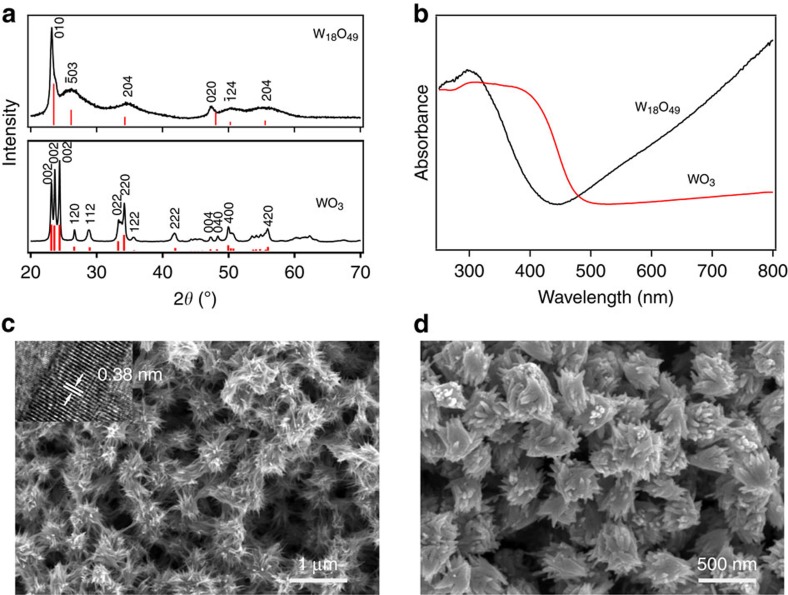
Figure 1. Characterization of W18O49 and annealed WO3 samples.
(a) X-ray diffraction patterns of as-obtained W18O49 sample and annealed WO3 with all reflections perfectly indexed; (b) ultraviolet–visible profile comparison between W18O49 sample and annealed WO3, showing a blue shift and an obvious absorption tail beyond the edge that may arise from the presence of oxygen vacancies; (c,d) scanning electron microscopy images for W18O49 and WO3 samples, respectively. Inset in (c): high-resolution transmission electron microscopy image on one single nanowire illustrating clear lattice fringe of 0.38 nm, which suggested that the nanowire growth was along the [010] direction.

