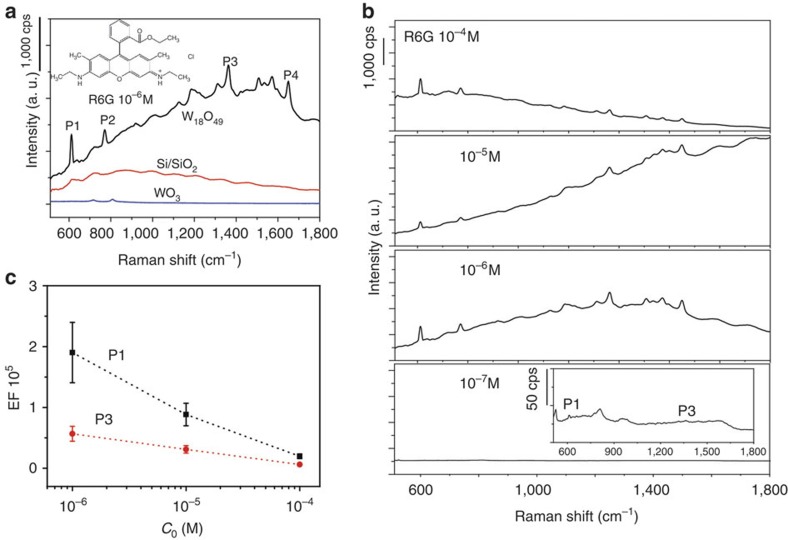
Figure 3. SERS properties.
(a) Raman profile of R6G (10−6 M) on substrates deposited with W18O49 sample compared with that for WO3 and bare SiO2/Si substrate. Inset: molecule structure of R6G. (b) Raman spectra collected for W18O49 at four different concentrations, 10−4, 10−5, 10−6 and 10−7 M, suggesting the detection limit was as low as 10−7 M (Inset: with narrowed y scale for 10−7 M). (c) The statistical evolution of EF as a function of R6G concentration plotted in logarithmic scale, with the analysis carried out over 30 different regions per sample. The Raman enhancement typically increased with decreasing concentrations and selective enhancement occurred with different bands.

