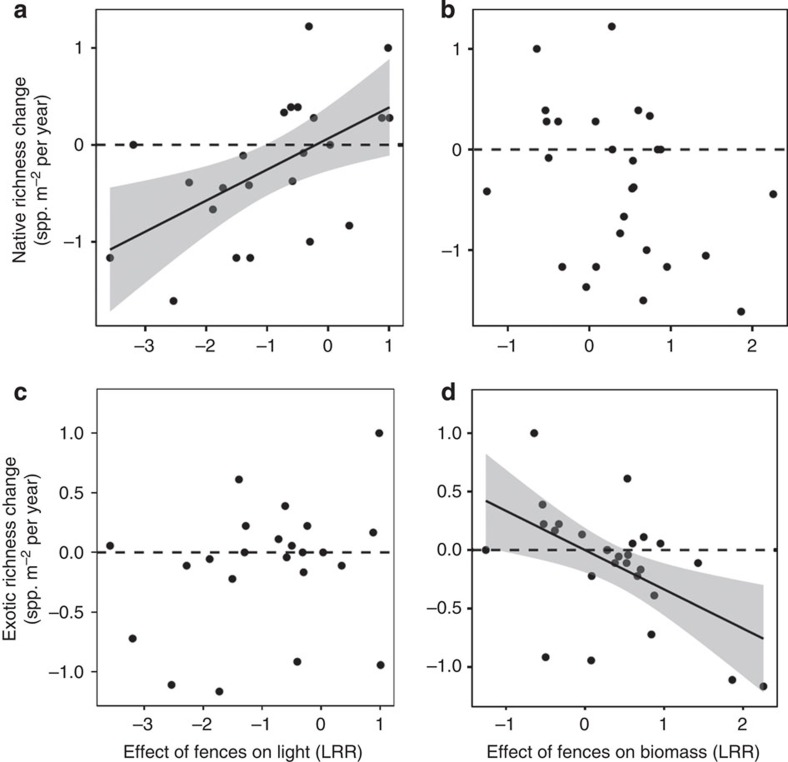
Figure 4. Effects of consumer fencing on native richness (a and b) exotic richness (c and d) ground-level light (a and c), and total biomass (b and d).
Richness effects are measured as the difference from pre-treatment values. Light and biomass effects are presented as log ratios (difference of logged values) relative to pre-treatment values. All effects are shown after three years of treatment. Significant linear regressions (P<0.05) are shown with a 95% confidence interval, the grey shaded area.

