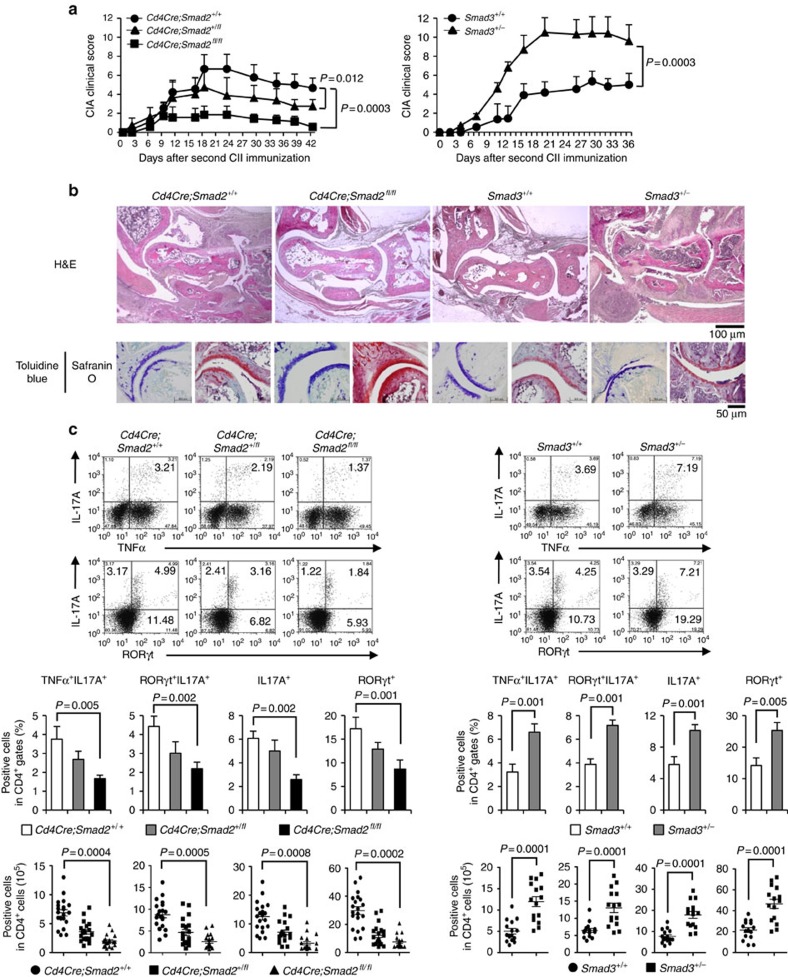
Figure 1. Opposing effects of Smad2 and Smad3 on TH17 response in CIA.
Cd4Cre;Smad2+/+, +/fl, fl/fl and Smad3+/+, +/− mice were immunized with type II collagen emulsified in complete Freund adjuvant twice in 3 weeks interval to induce CIA. (a) CIA scoring courses of Cd4Cre;Smad2+/+, Cd4Cre;Smad2+/fl, Cd4Cre;Smad2fl/fl mice (left, n=11/Cd4Cre;Smad2 genotype) and Smad3+/+, Smad3+/− mice (right, n=13/Smad3 genotype) with P values (two-way analysis of variance (ANOVA) test). (b) Pathological analyses of the joint sections (haematoxylin and eosin, H&E, magnification, × 40, scale bar, 100 μm, toluidine blue and safranin O, magnification, × 200, scale bar, 50 μm). (c) Flow cytometry analyses of IL-17A+TNF-α+ CD4+ T cells and RORγt+IL-17A+ CD4+ T cells in the draining lymph nodes of Cd4Cre;Smad2+/+,+/fl, fl/fl (n=20/Cd4Cre;Smad2 genotype) and Smad3+/+,+/− mice (n=15/Smad3 genotype) on day 14 after second immunization. Graphs show the percentages and cell numbers of IL-17A+, RORγt+, IL-17A+TNF-α+ and IL-17A+RORγt+ in CD4+ gates in the draining lymph nodes. Data are from one experiment representative of seven (a,b), four (c, Cd4Cre;Smad2) or three (c, Smad3) independent experiments. Graphs show mean+s.d. with P values (unpaired Student's t-test).

