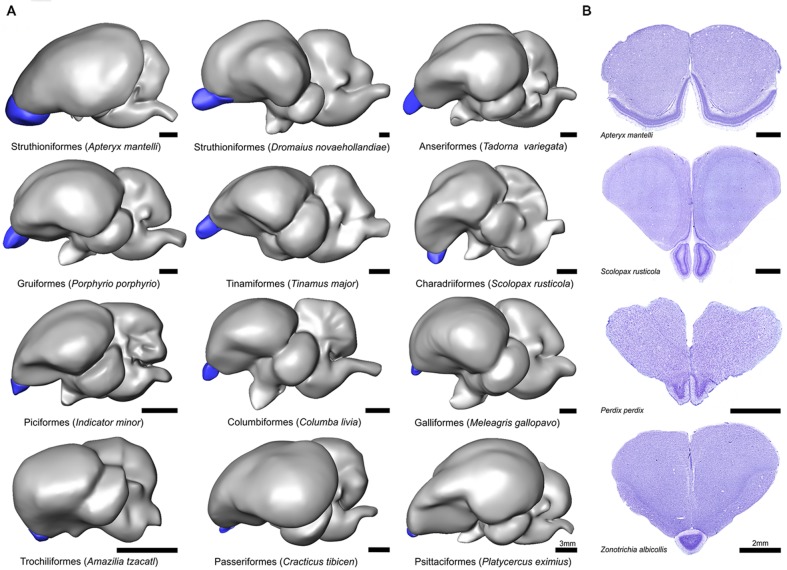
FIGURE 1.
Gross morphology of the olfactory bulbs (OBs) in birds. (A) Lateral view of 3D models of 12 representative avian species. Blue denotes the OBs and models are organized from largest to smallest. Scale bar = 3 mm. (B) Coronal Nissl stained sections showing the OBs in four representative avian species and illustrating the cytoarchitectural and cross species variation. Scale bar = 2 mm.

