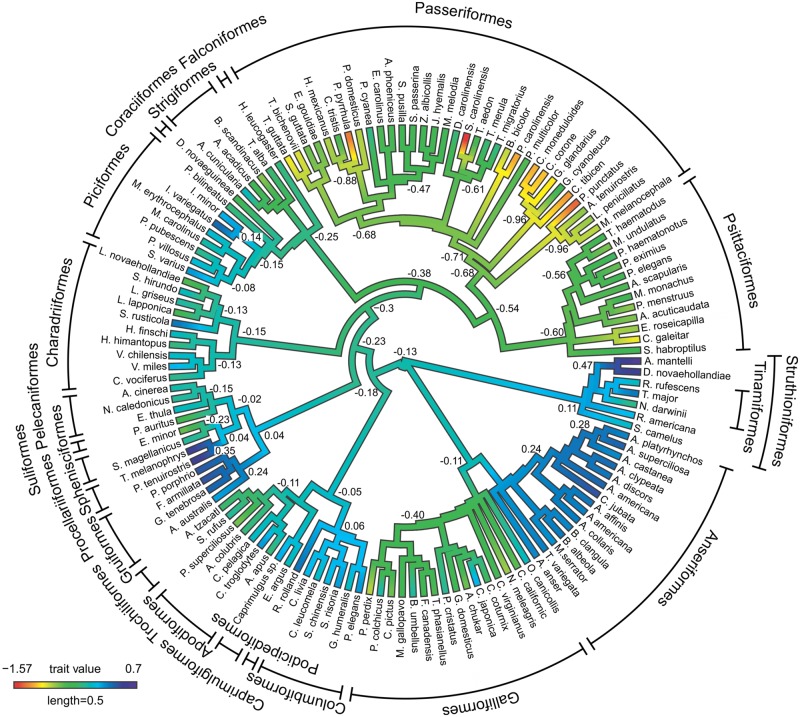
FIGURE 3.
Ancestral character estimates for OB volumes plotted onto an avian phylogeny. This method uses ancestral character estimation to visualize historical character states for OB volumes (plotted as a continuous trait) along the branches of a tree (see methods, Revell, 2013). The trait mapped was the relative size of OBs expressed as the residuals of the best fitting PGLS model of OBs against brain volume-OBs. The phylogeny is largely based on Hackett et al. (2008), with further resolution coming from other studies (see Materials and Methods).

