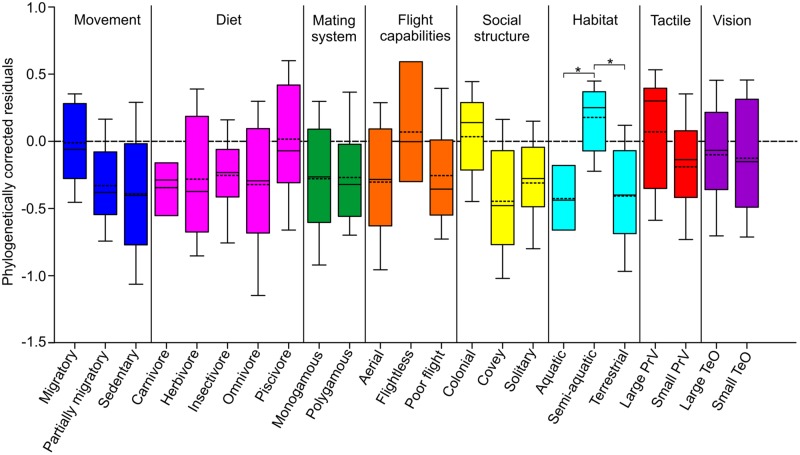
FIGURE 4.
Variation in OB sizes in relation to ecology and behavior. Box and whisker plots show the variation in OB volumes among the different ecology and behavior categories, as calculated from phylogenetically corrected residuals. For each ecological niche category, the ‘box’ represents the second quartile and the error bars (‘whiskers’) are the first and third quartiles. The horizontal bar in each box represents the median, while the broken line indicates the mean. Asterisks indicate statistically significant differences (p < 0.05).

