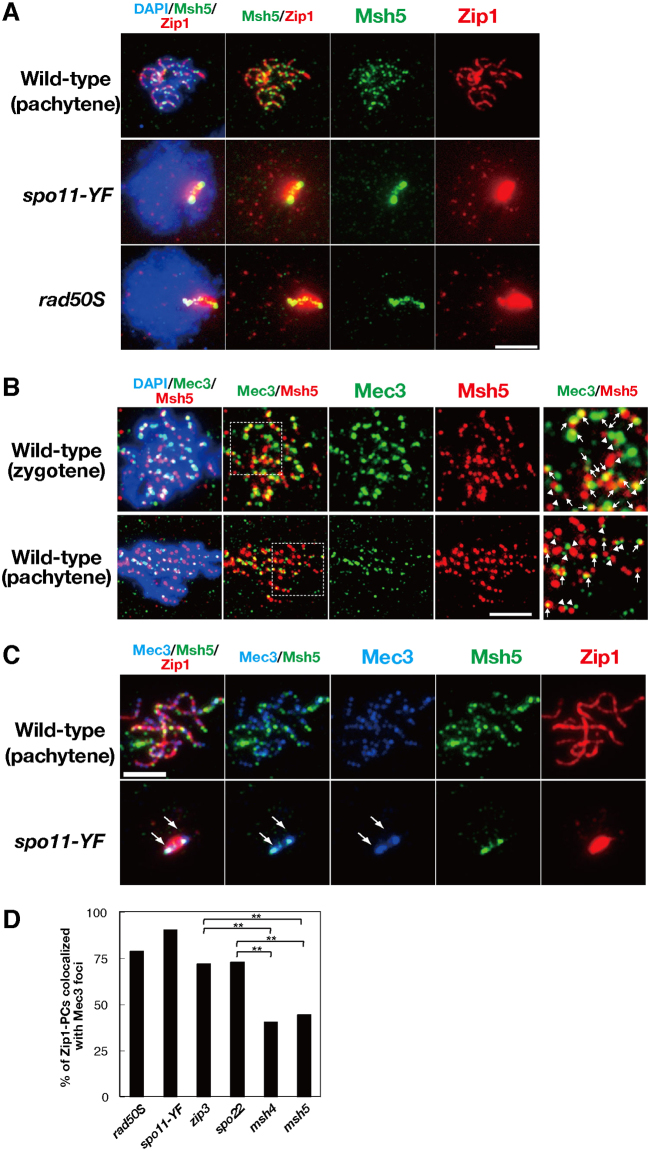
Fig. 3.
Colocalization of Mec3 and Msh5 on Zip1-polycomplex.Colocalization of Mec3 and Msh5 on Zip1-polycomplex. (A) Staining of Zip1 (red) and Msh5 (green) in the wild-type, spo11-Y135F, and rad50S strains. A representative image at 4 hours is shown. (B) Staining of Msh5 (red) and Mec3 (green) in the wild type. Representative images for zygotene (top) and pachytene (bottom) are shown. Enlarged regions are shown to the right. Arrows and arrowheads show colocalized and side-by-side staining for Mec3 and Msh5, respectively. (C) Triple staining of Zip1 (red), Msh5 (green), and Mec3 (blue) in the wild-type and the spo11-Y135F mutant. Arrows indicate bipolar localization of Mec3 at the ends of Zip1 polycomplex. Scale bars: 4 µm. (D) Colocalization frequencies of Mec3 foci or patches with Zip1 polycomplexes. Randomly selected nuclei containing Zip1 polycomplexes were assessed for colocalization with Mec3 foci or patches. More than 120 spreads were examined for each strain. **P<0.01 (chi-squared independent test). zip3 versus msh4, P = 2.7×10⁻⁵; zip3 versus msh5, P = 4.9×10⁻⁶, spo22/zip4 versus msh4, P = 2.6×10⁻⁴; spo22/zip4 versus msh5, P = 6.1×10⁻⁵.

