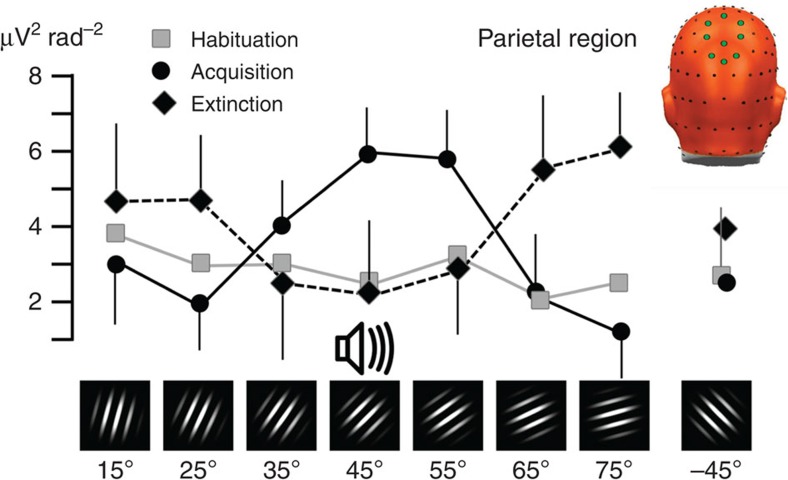
Figure 2. Parietal retuning during aversive conditioning.
Grand mean (N=15) pooled visual electrocortical activity over parietal cortical sites is shown for each phase of the experiment (habituation, acquisition and extinction) and for each grating orientation. Spectral power of ssVEP current source density is shown, averaged across parietal midline sensor locations, shown as green circles in the top right inset. Note the generalization (quadratic) pattern with amplification of the 45° grating that was paired with noise, and a monotonic decline to distal orientations, specifically during fear acquisition. Error bars (s.e.m.) are shown for the acquisition and extinction phases.

