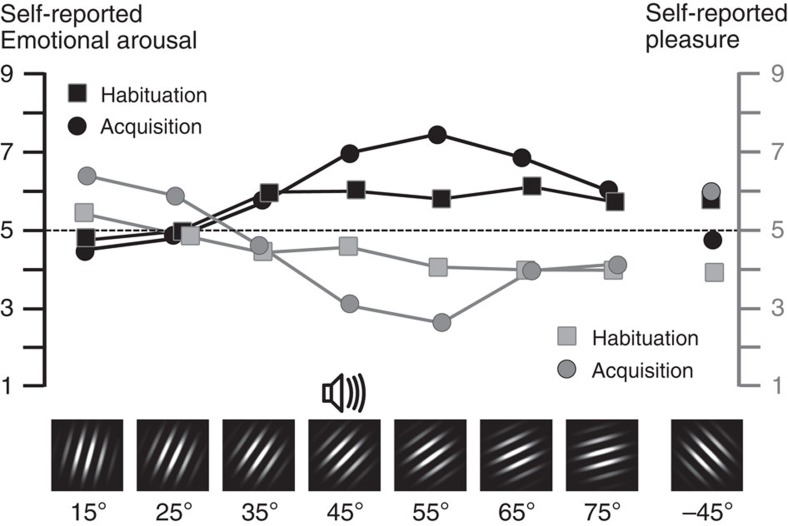
Figure 4. Self-report changes during aversive conditioning.
Grand mean (N=15) self-reported emotional arousal (black lines, left scale) and pleasure (grey lines, right scale), comparing post-habituation (squares) and post-acquisition ratings (circles) for each orientation, on the SAM nine-point scale.

