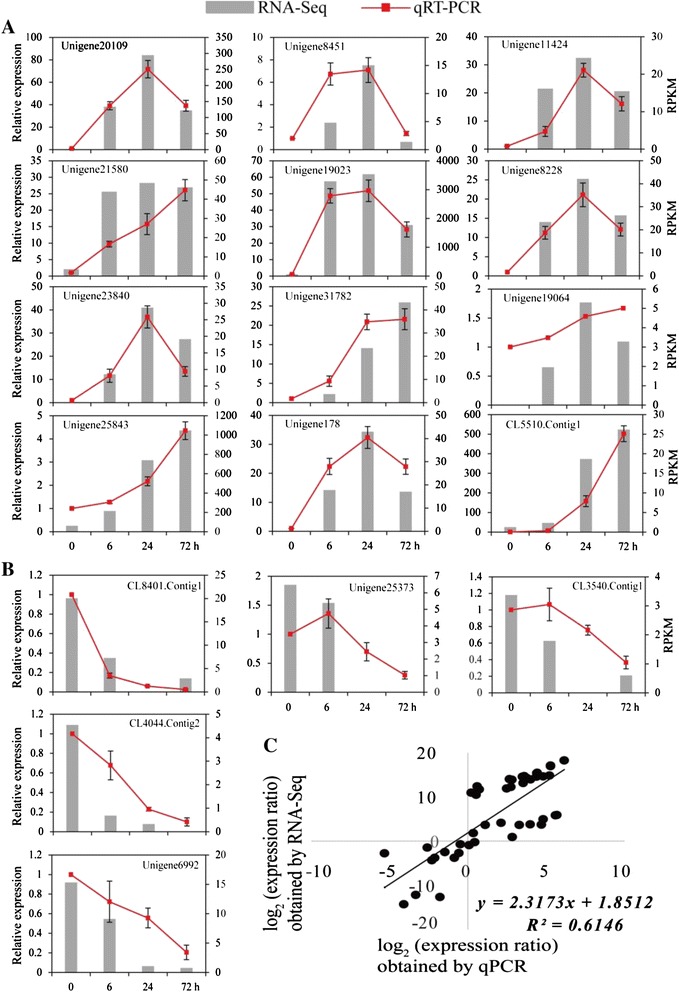
Fig. 7.

qPCR analysis of differentially expressed genes in Poncirus trifoliata under low temperature. (a, b) Transcript levels of 17 randomly selected DEGs, including 12 up-regulated (a) and 5 down-regulated (b). The Y-axis on the left shows the relative gene expression levels analyzed by qPCR (red lines), while Y-axis on the right shows corresponding expression data of RNA-seq (gray histogram). The X-axis represents the time (hours) of 4 °C treatment. The bars represent SE (n = 3). (c) Comparison between the log2 of gene expression ratios obtained from RNA-seq data and qRT-PCR
