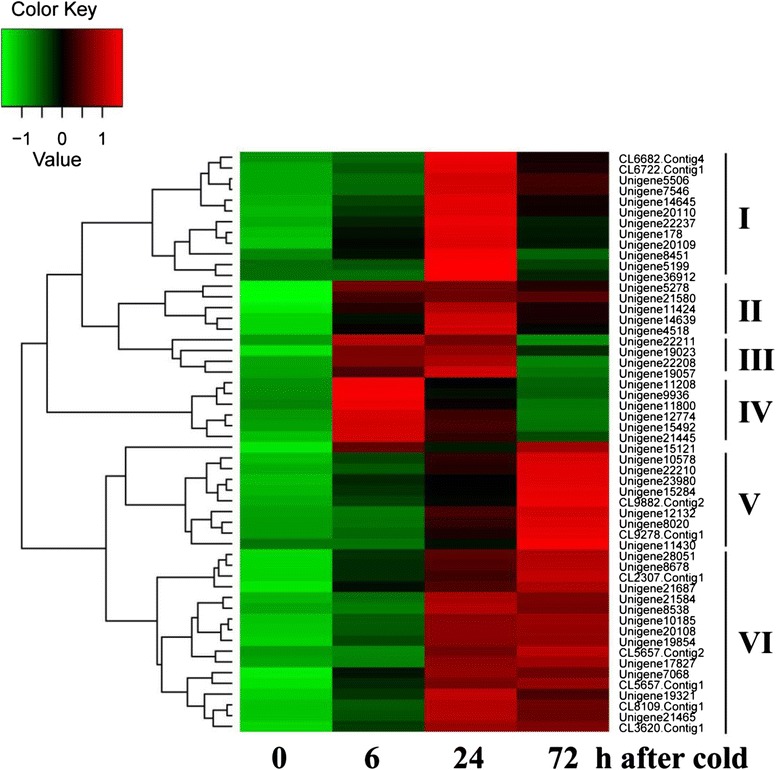
Fig. 9.

A heat map indicating expression patterns of transcription factors under cold stress. Columns and rows in the heat map represent samples collected at differenet time points of cold stress and common differenttially expressed TFs, respectively
