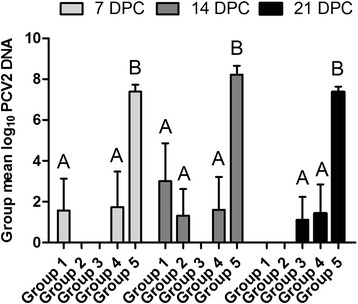
Fig. 3.

Comparison of the PCV2 DNA loads in sera of the differently treated pigs challenged with PCV2. The PCV2 genomic copy load was presented as a log10 value of PCV2 genomic copy load per 1 ml of sera. Different letters (A, B) indicate significant differences among different groups at 7, 14, or 21 DPC (P < 0.05)
