
Fig. 3.
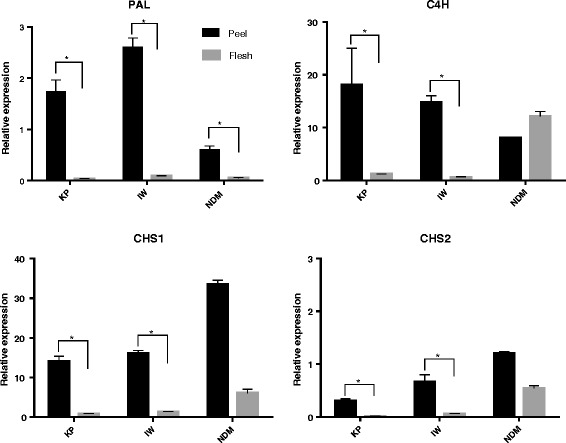
Relative expression levels of PAL, C4H and CHSs mRNAs in mango peel (black) and flesh (grey) determined by Real-time RT-PCR. For all panels the data represent mean ± SEM relative to the Actin control (n = 3, *P < 0.01)
Official websites use .gov
A
.gov website belongs to an official
government organization in the United States.
Secure .gov websites use HTTPS
A lock (
) or https:// means you've safely
connected to the .gov website. Share sensitive
information only on official, secure websites.
Relative expression levels of PAL, C4H and CHSs mRNAs in mango peel (black) and flesh (grey) determined by Real-time RT-PCR. For all panels the data represent mean ± SEM relative to the Actin control (n = 3, *P < 0.01)