
Fig. 4.
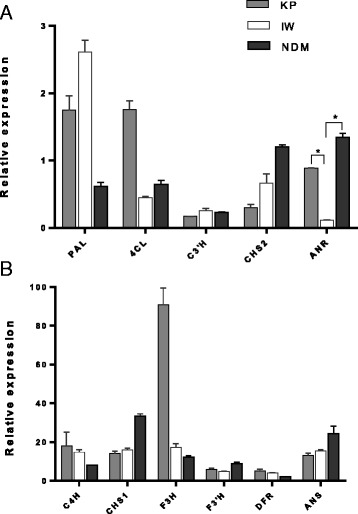
Relative expression levels of flavonoid biosynthetic genes in the peel of three mango fruit varieties determined by Real-time RT-PCR. a PAL, 4CL, C3’H, CHS1 and ANR. b C4H, CHS1, F3H, F3’H, DFR and ANS. For all panels the data represent mean ± SEM relative to the Actin control, (n = 3, *P < 0.01)