
Fig. 4.
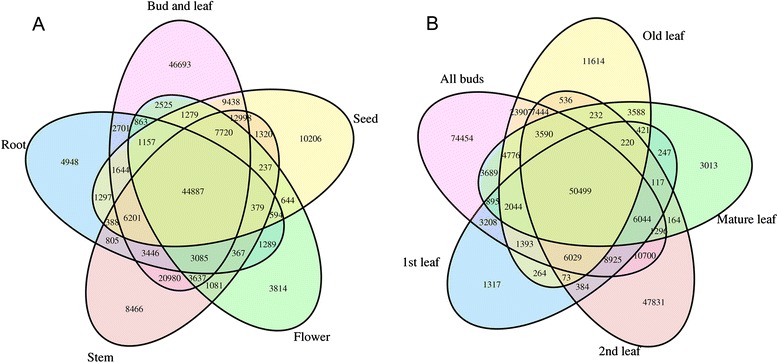
Venn diagram of co-expressed and uniquely expressed unigenes from different tissues of C. sinensis. a Statistics regarding the co-expressed and uniquely expressed unigenes in all of the tissues studied. The “bud and leaf” group comprised the samples “one and a bud” and “two and a bud”, and the other labels represent the indicated tissues. b Statistics regarding the co-expressed and uniquely expressed unigenes in the buds and leaves. The “All buds” sample comprised the samples “apical bud”, “lateral bud at early stage”, and “lateral bud”, and the other labels represent the indicated tissues