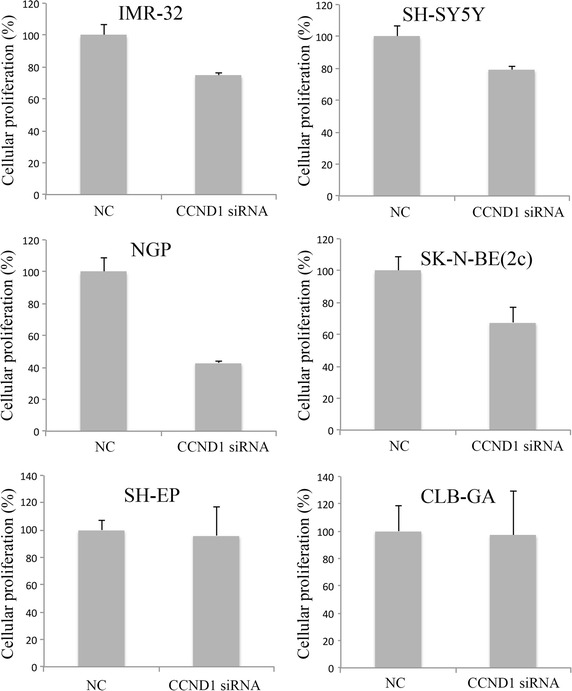
Fig. 2.

Assessment of cellular proliferation after knockdown of CCND1. The cellular proliferation was measured in real time using the xCELLigence system. The data shown represents the percentage of cellular proliferation after 72 h of knockdown of CCND1. NC scrambled siRNA negative control. Error bars represent the standard deviation (n = 2).
