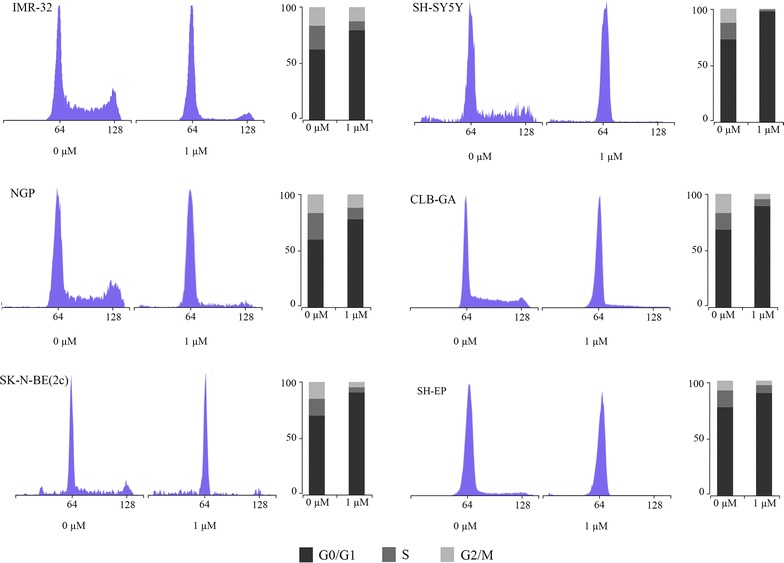
Fig. 4.

Cell cycle analysis after treatment with palbociclib. DNA histograms generated by flow cytometry for neuroblastoma cell lines treated with palbociclib for 24 h. The DNA histograms show the distribution of cell populations in each phase of the cell cycle. The percentages of cells are shown to the right of each histogram.
