
Fig. 1.
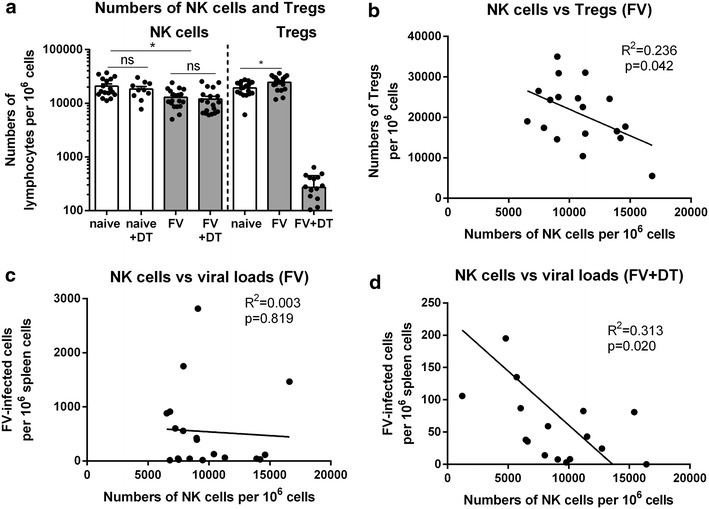
Correlation of NK cell frequencies with Treg frequencies and viral loads. DEREG mice were infected with FV and depleted for Tregs by repeated injections of DT. Uninfected DEREG mice were used as controls. Splenocytes were isolated at 12 dpi and proportions of NK cells (CD3−CD49b+NK1.1+) and Tregs (CD4+Foxp3+) were determined using flow cytometry (a, b). As a control numbers of Tregs following application of DT in transgenic DEREG mice were also shown (a, right column). Individual proportions and mean (±SEM) values are indicated by bars and dots. Viral loads of FV-infected mice (c) and FV-infected and Treg-ablated mice (d) were analyzed by infectious center assay and correlated to proportions of NK cells. A minimum of ten mice per group were used. Experiments were repeated at least three times. Statistically significant differences between the groups in a were determined by Kruskal–Wallis one-way analysis and Dunn’s multiple comparison tests (NK cells) or by using the unpaired student’s t test (Tregs) and are indicated by single asterisk for p < 0.05 and ns not significant. Statistically significant correlations were analyzed using the Pearson correlation test and results were shown in the graph.