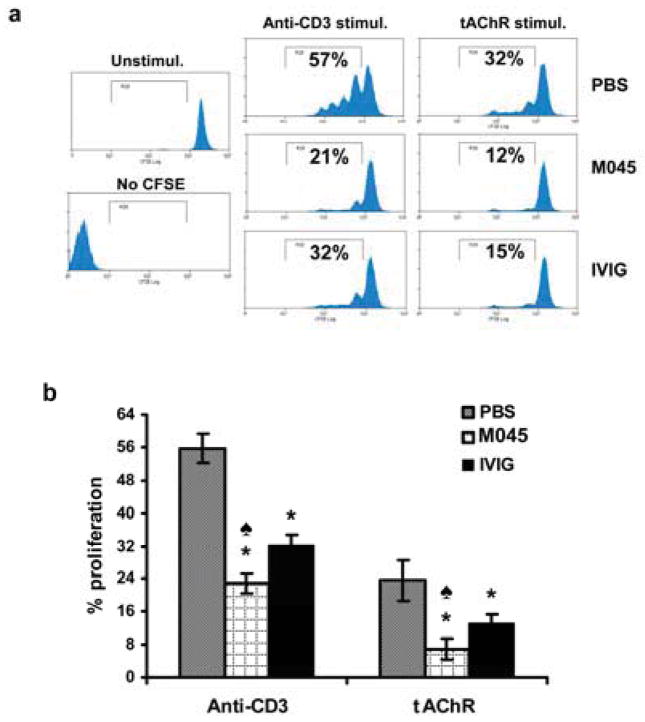
Figure 4. Recombinant IgG2a Fc multimer (M045) suppresses polyclonal and antigen-specific T cell proliferation.
CFSE-labeled splenocytes were stimulated with anti-mouse CD3 or tAChR as described in Materials and methods. (a) Representative flow cytometry plots illustrate CFSE dilution profiles of anti-CD3 and tAChR driven T cell proliferation. (b) Bar diagram shows the percent of CD4+ T cell proliferation from splenocyte cultures upon stimulation with anti-CD3 and tAChR. The values in the bar diagram represent the mean ± SEM of duplicate values of three separate experiments. Significance at p<0.05. *, compared to PBS; ♠, compared to IVIG.

