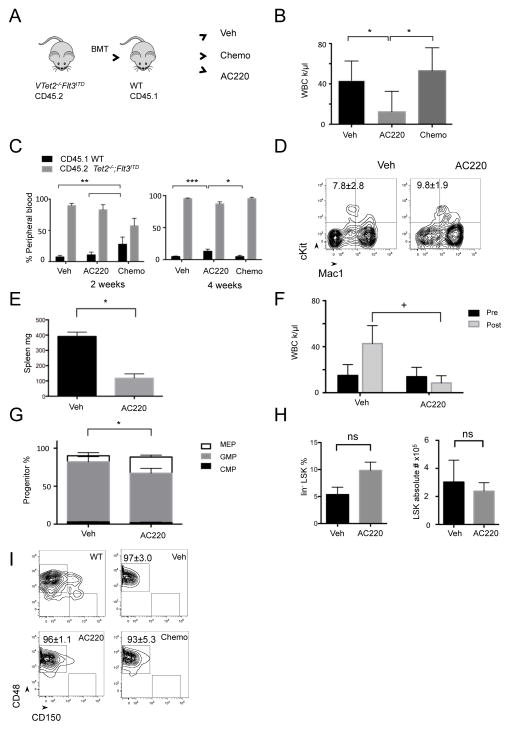
Figure 3. Response of VTet2−/−Flt3ITD leukemia to AC220 and chemotherapy.
(A) Treatment scheme with secondary transplanted CD45.2+ Tet2−/−;Flt3ITD bone marrow into CD45.1+ mice (n=5 per group). (B–D) Peripheral blood WBC count after treatment for 4 weeks (B), CD45.1 (host-derived marker) and CD45.2 (leukemia-derived marker) immunophenotype at 2 weeks and 4 weeks (C), and Mac1 and cKit immunophenotype at 4 weeks (D) of vehicle, chemotherapy treated, and AC220 treated mice. (E,F) Spleen size (E) and peripheral blood WBC count (F) of VTet2−/−Flt3ITD mice treated with AC220 for 4 weeks (n=3 per group). (G–I) Bone marrow myeloid progenitor analysis (G), LSK percentage and absolute number (H), and SLAM LSK immunophenotype analysis, gates indicated for MPPs (CD48+CD150−) and LT-HSC (CD48−CD150+) fractions (I) following vehicle, chemotherapy, or AC220 treatment. +p<=.05, *p<=.01, **p<=.001, ***p<=.0001. p values using unpaired Student’s t-test. Graphs and flow plot numbers, mean±SEM. See also Figure S3.

