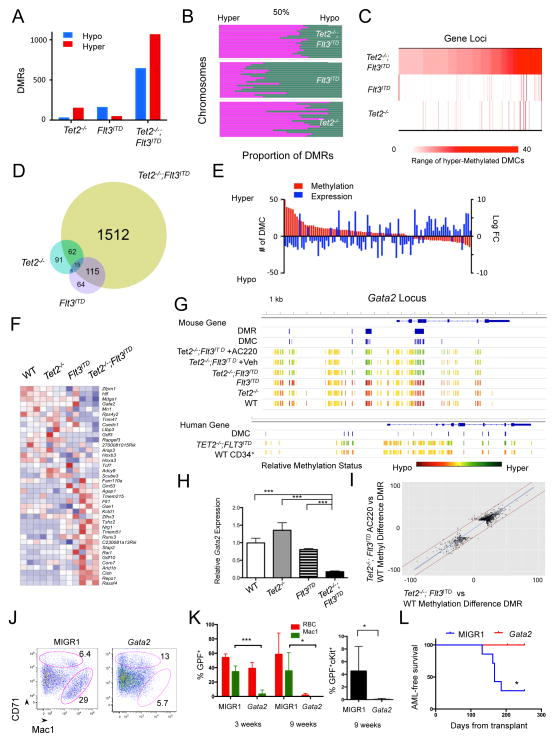
Figure 5. Flt3ITD mutation and Tet2 loss synergistically regulate gene expression.
(A,B) Number of differentially methylated regions (DMRs) (A) and chromosomal hypermethylation and hypomethylation proportions (B) in Tet2−/−, Flt3ITD, Tet2−/−;Flt3ITD LSKs. (C) Heat map of number of hypermethylated differentially methylated cytosines (DMCs) in 424 genes in Tet2−/−;Flt3ITD LSKs compared to number of DMCs in Tet2−/− and Flt3ITD LSKs. (D) Venn diagram of genes associated with DMRs for each genotype. (E) Bar graph of paired DMC number (in red) and expression change (in blue) for genes with promoter and intron DMCs and differential RNA expression. (F) Heat map of RNA expression based on genes in Table 1 (>=6 DMCs and altered expression in Tet2−/−;Flt3ITD LSKs) for LSKs of each genotype. z-score scale. (G) Gata2 locus methylation for LSK cells, LSK cells following treatment, and human ST-HSC leukemia and CD34+ cell populations (scaled to average methylation). Also, location of DMRs and DMCs as determined through eRRBS analysis. (H) Gata2 relative RNA expression in LSK cells. (I) Scatter plot of corresponding DMRs between Tet2−/−;Flt3ITD LSKs and Tet2−/−;Flt3ITD AC220 treated LSKs. Fitted line in blue; +/− 20% variation between samples by red lines. (PearsonCorr=0.948) (J) CD71 and Mac1 immunophenotype of methylcellulose colonies from Tet2−/−;Flt3ITD cells expressing MIGR1 control or Gata2, mean gate frequency. (K,L) Peripheral blood GFP% of red blood cells (RBC), Mac1+ cells, and cKit+ cells at 3 weeks and 9 weeks (K) and leukemia free survival (L) of mice transplanted with MIGR1 (n=7) and Gata2 (n=5) transduced Tet2−/−;Flt3ITD bone marrow. *p<=.01, ***p<.0001, using unpaired Student’s t-test. Graphs mean±SEM. Survival statistic by long-rank test. See also Figure S5, Table S4 – S7.

