Fig. 1.

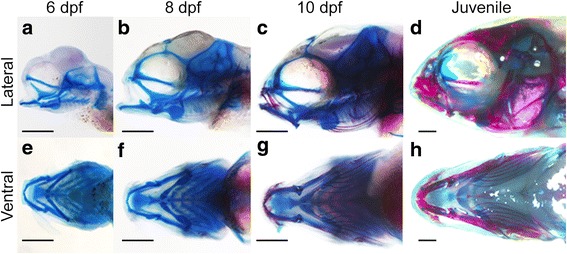
Time course of craniofacial development analyzed. a–d Lateral and e–h ventral views of time points analyzed. Scale = 500 μm

Time course of craniofacial development analyzed. a–d Lateral and e–h ventral views of time points analyzed. Scale = 500 μm