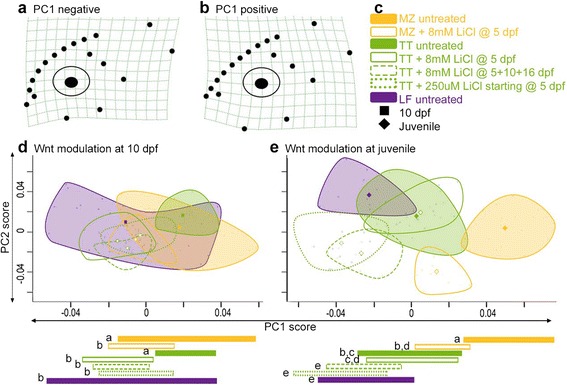
Fig. 6.

Continued modulation of Wnt signaling shifts lateral developmental trajectory. a, b Variation in lateral shape described by PC1 at juvenile stages following Wnt modulation. PC1 at 10 dpf describes similar variation (see Additional file 1: Figure S9). c Legend of colors and symbols used. d Lateral morphospace at 10 dpf. e Lateral morphospace at juvenile stages. Bars underneath plots indicate range of PC1 scores for each species/treatment. Letters by bars indicate statistical grouping based on ANOVA with Tukey’s HSD using a cutoff of p = 0.05
