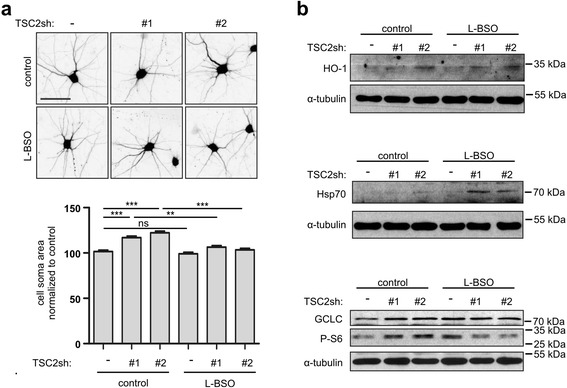
Fig. 3.

GCLC inhibitor L-BSO blocks aberrant growth, induces stress response and inhibits mTORC1 in TSC2 depleted neurons. a Representative images and neuron soma area of TSC2-depleted and control neurons treated with 10 μM L-BSO. Scale bar: 50 μm. Plot represents mean +/−SEM. ns- not significant, **p < 0.01, ***p < 0.001 in Kruskal-Wallis with Dunn’s post-hoc test. Sample sizes for experimental groups are provided in Supplementary materials and methods (Additional file 1). b Western blot analysis of HO-1, Hsp70, GCLC and mTORC1 activity marker, P-S6, levels in TSC2-depleted and control neurons after L-BSO treatment. α-tubulin is shown as a loading control
