
Fig. 5.
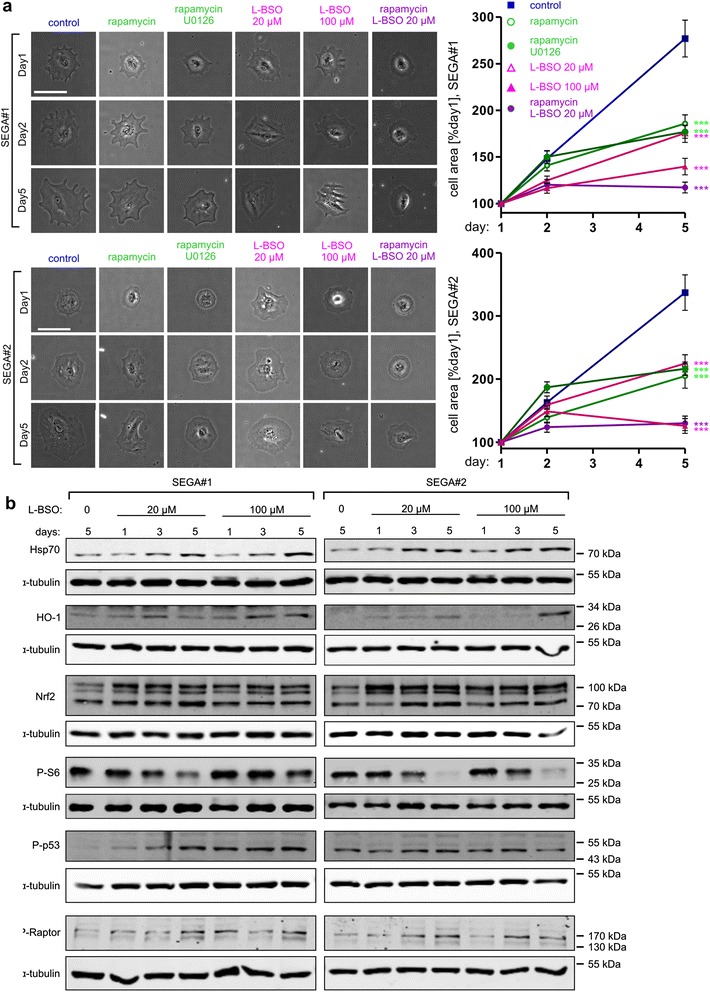
GCLC inhibition blocks growth of SEGA-derived cells and causes cellular stress, and mTORC1 inhibition. a Representative images (left) and results of cell surface area analysis (right) of SEGA-derived cells imaged 3 times during a 5 day-treatment. SEGA#1 and SEGA#2-derived cells were treated with 20 nM rapamycin, 20 nM rapamycin with 20 μM U0126 or 20 μM L-BSO, and 20 or 100 μM L-BSO. Scale bar: 100 μm. The plots represent mean +/− SEM from two independent experiments. ***p < 0.001 in two-way ANOVA compared to control treated with DMSO. Sample sizes for experimental groups are provided in Supplementary materials and methods (Additional file 1). b Western blot analysis of stress markers (Hsp70, HO-1), Nrf2, mTORC1 activity marker P-S6, genotoxic stress marker P-p53 and P-Raptor in SEGA-derived cells lysed after a 1-, 3- or 5-day treatment with 20 or 100 μM L-BSO. α-tubulin is shown as a loading control