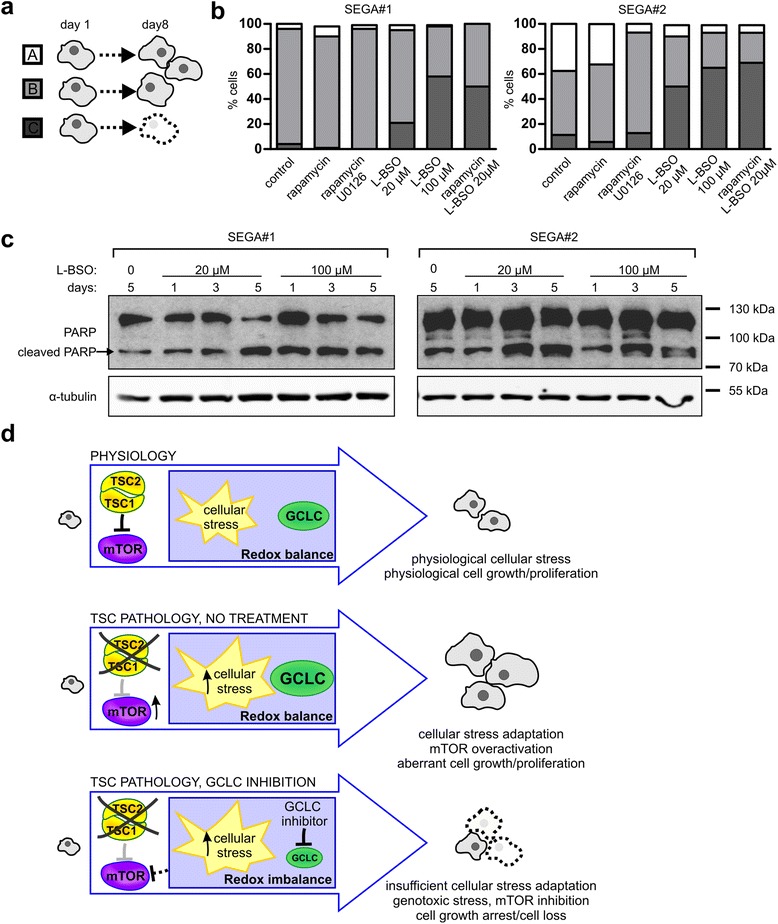
Fig. 6.

GCLC inhibition causes death of SEGA-derived cells. a Schematic representation of SEGA-derived cell classes after an 8-day treatment. b Percentage of cells classified to class A, B, or C after treatment with 20 nM rapamycin, 20 nM rapamycin with 20 μM U0126 or 20 μM L-BSO, and 20 or 100 μM L-BSO. SEGA#1 and SEGA#2-derived cells were imaged 4 times during the treatment. Next, the fate of each cell was followed and classes were assigned. Sample sizes for experimental groups are provided in Supplementary materials and methods (Additional file 1). For additional information, see also Additional file 3: Figure S3. c Western blot analysis of PARP (full length and cleaved, upper and lower band, respectively) in SEGA-derived cells lysed after a 1-, 3- or 5-day treatment with 20 or 100 μM L-BSO. α-tubulin is shown as a loading control. d Proposed model of GCLC contribution to TSC-related tumors development
