
Fig. 2.
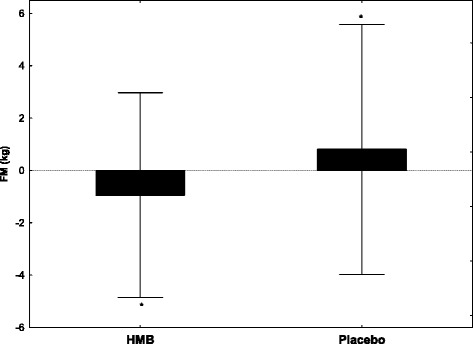
Changes in fat mass after 12-week supplementation of HMB. Values are expressed as mean ± SD. Significant differences compared with placebo (independent samples t-tests) at: * p = 0.03
Official websites use .gov
A
.gov website belongs to an official
government organization in the United States.
Secure .gov websites use HTTPS
A lock (
) or https:// means you've safely
connected to the .gov website. Share sensitive
information only on official, secure websites.
Changes in fat mass after 12-week supplementation of HMB. Values are expressed as mean ± SD. Significant differences compared with placebo (independent samples t-tests) at: * p = 0.03