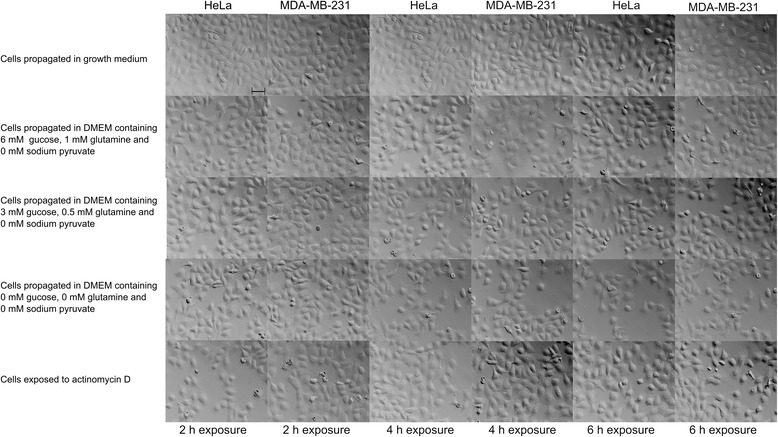
Fig. 1.

PlasDIC images after short-term exposures (2 h, 4 h, 6 h) glutamine- and glucose starvation. PlasDIC images of HeLa and MDA-MB-231 cells propagated in media according to metabolic state and cells exposed to actinomycin D for 2 h, 4 h and 6 h. Exposure to DMEM containing 6 mM glucose and 1 mM l-glutamine for 2 h resulted in decreased cell density. Exposure to DMEM containing 0 mM-3 mM glucose and 0 mM-0.5 mM l-glutamine for 2 h resulted in decreased cell density and rounded shrunken cells. After 4 h cells propagated in medium containing 6 mM glucose and 1 mM L-glutamine exhibited decreased cell density and rounded shrunken cells. Cells propagated in medium containing low quantities of glucose and glutamine or no glucose and glutamine for 4 h demonstrated decreasing cell density and increased number of cells appearing rounded and shrunken when compared to cells exposed to DMEM containing 6 mM glucose and 1 mM l-glutamine and cells propagated in growth medium. Cells propagated in DMEM containing 6 mM glucose and 1 mM l-glutamine for 6 h demonstrated decreased cell density and the presence of some rounded shrunken cells. The latter was also observed with cells propagated in DMEM containing 3 mM glucose and 0.5 mM l-glutamine for 6 h. The cells propagated in DMEM containing 0 mM glucose and 0 mM l-glutamine for 6 h also demonstrated the presence of some rounded shrunken cells and decreased cell density. The latter was more pronounced when compared to cells propagated in DMEM containing 3–6 mM glucose and 0.5-1 mM l-glutamine growth medium for 6 h. After 6 h exposure, cells were mostly present in interphase with cells still attached. The scale bar in all images represents 50 μm
