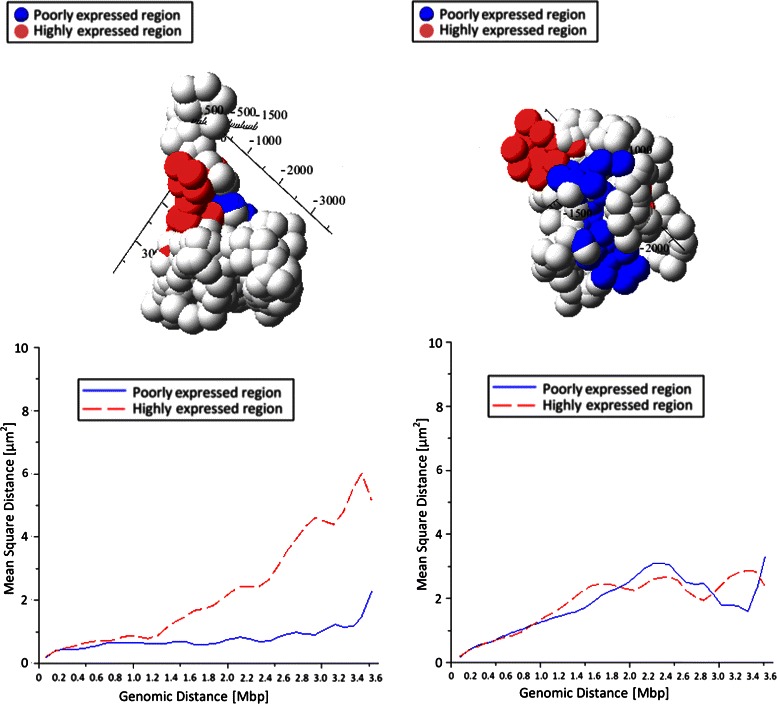
Fig. 4.

Example results. Top: the two typical configurations resulting from the data in Fig. 3 (measurements in nm). The model parameters used are: i) cardinality of sets for the high-resolution subchains: 20; ii) cardinality of set for the low-resolution chain: 40; iii) minimum distance between beads, at maximum resolution, to avoid interference: 120 nm; iv) maximum distance between any two beads: 10 μm; v) maximum angle between two consecutive bead pairs (curvature): 100 °. The red and blue beads belong, respectively, to a highly expressed and a poorly expressed regions. Bottom: mean-square Euclidean distances between pairs of beads, as functions of their genomic distances, for the red and the blue regions
