
Fig. 2.
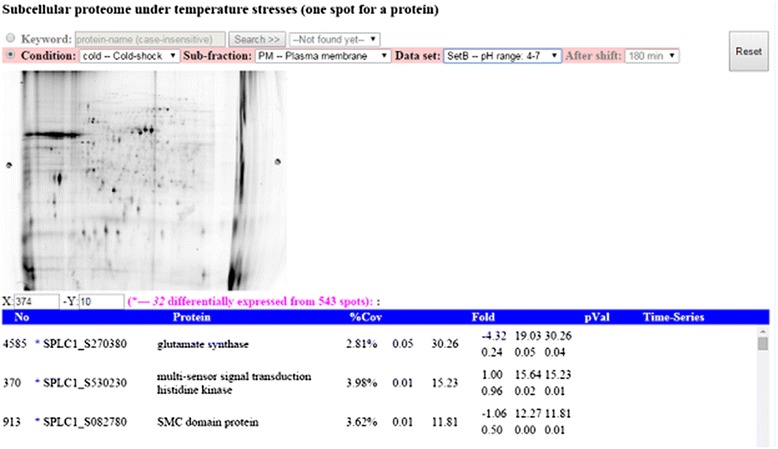
Example of using 2D-gel image tool to depict proteome results from selected condition. A list of identified proteins from protein spots (black spot in the image) is shown in the table, sorted by absolute value of fold-change. The asterisk marks before the ORF names denote such proteins that are differentially expressed