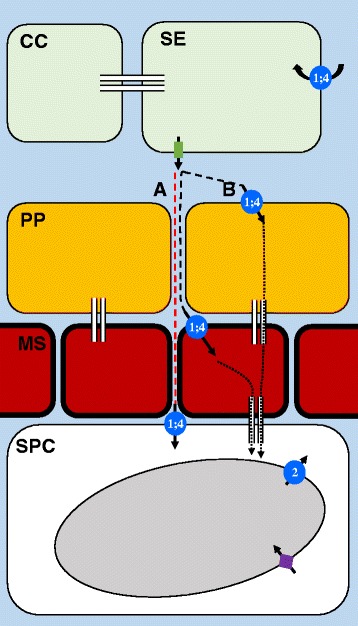
Fig. 10.

Model for sucrose movement from stem phloem to storage parenchyma cells in sorghum. The phloem companion cells (CC) and sieve elements (SE) are shown in green; the phloem parenchyma (PP), in orange; the mestome sheath (MS) cells, in red; and storage parenchyma cell (SPC), in white. The apoplasmic space is indicated by the light blue background. A vacuole in the SPC is shown in grey. Plasmodesmata are shown by thin, white rectangles. The red dashed line (a) indicates an entirely apoplasmic path for sucrose. The black dashed lines (b) indicate sucrose initially moving through the apoplasm, followed by import into either the PP or MS cells, and the black dotted lines represent sucrose symplasmic movement. SUT proteins are shown by a blue circle, with an arrow indicating the direction of sucrose uptake, and the numbers represent SbSUT1 and/ or SbSUT4 (1;4), or SbSUT2 (2). Green rectangle with an arrow indicates a SWEET sucrose effluxer, and purple diamond with arrow refers to TST protein located on the tonoplast
