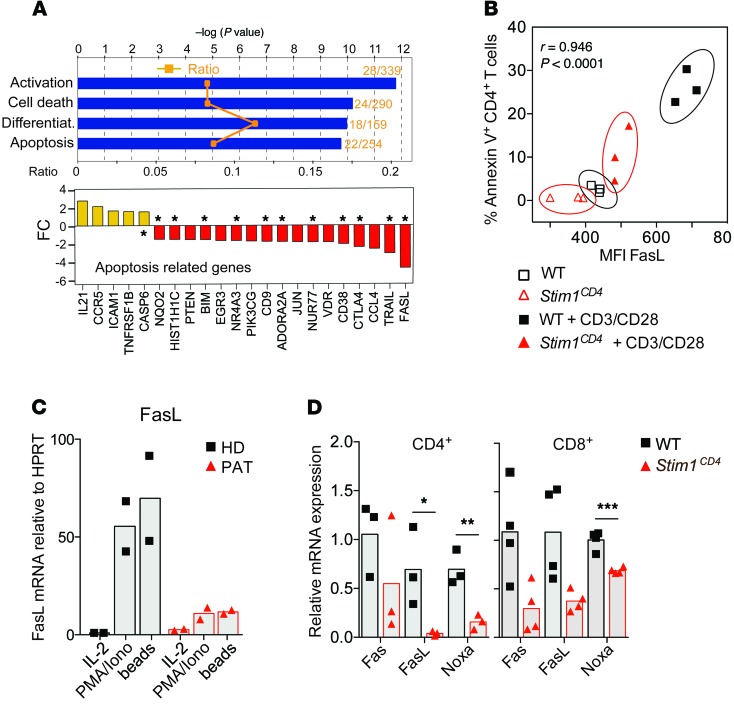
Figure 4. STIM1-dependent regulation of proapoptotic factors in T cells.
(A) Microarray analysis of mRNA expression in CD4+ cells from the spleens of WT or Stim1CD4 mice (3 mice per group) stimulated for 48 hours with αCD3/αCD28. Bar graphs show the results of a pathway analysis (IPA software) indicating the ratio of dysregulated genes per pathway (orange symbols, top panel), statistical significance (blue bars, top panel), and average fold changes (FC) in the expression of apoptosis-regulating factors (bottom panel; P < 0.05 for all genes shown). Asterisks denote known proapoptotic factors in T cells. (B) Correlation of the mean fluorescence intensity (MFI) of FasL expression on splenic CD4+ T cells and frequency of annexin V+ cells with or without restimulation with 2 μg/ml αCD3 for 16 hours. Correlation coefficient was calculated by Spearman’s rho test. (C) FasL expression by primary T cells from the peripheral blood of an HD and a PAT with ORAI1 p.R91W mutation (PAT) (10) after restimulation of cells for 16 hours with PMA/ionomycin (P+I), IL-2, or αCD3/αCD28-coated beads. Bar graphs are representative of 2 independent experiments. (D) Transcript levels of proapoptotic factors Noxa, Fas, and FasL in lungs of WT and Stim1CD4 mice 77 days after Mtb infection, as determined by quantitative RT-PCR. Gene expression was normalized to Cd4 and Cd8 mRNA levels. Each dot represents 1 mouse. Statistical significance was calculated by Student’s t test. *P < 0.05; **P < 0.01; ***P < 0.001.

