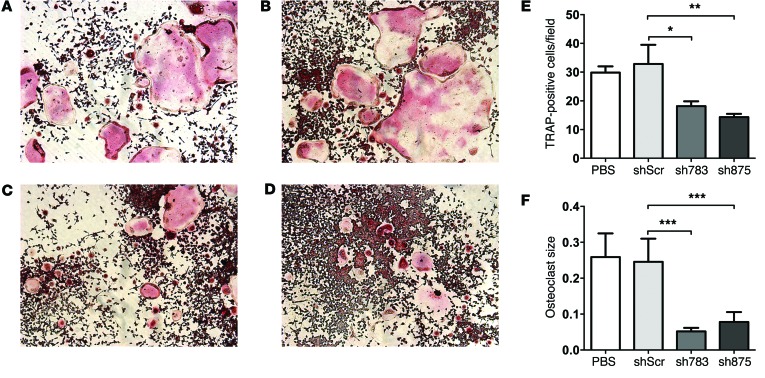
Figure 2. Knockdown of Ugcg inhibits OC formation.
OCs derived from non-transfected, PBS-treated (A) and transfected RAW264.7 cells (B–D) were TRAP stained and imaged using an Olympus inverted microscope with ×10 magnification. RAW264.7 cells were transfected with scrambled shRNA (shScr) (B) or with sh783 (C) or sh875 shRNA (D). OC count at ×10 fields from 2 different experiments, with each experiment performed in triplicate, was used to generate individual plots (E), and the mean size of OCs is expressed in pixels (F). Statistical differences in TRAP-positive cells (E) were analyzed with standard one-way ANOVA, and differences in mean size (F) were analyzed with the Kruskal-Wallis ANOVA test. Error bars correspond to SEM. n = 6; *P ≤ 0.05, **P ≤ 0.01, ***P ≤ 0.001.

