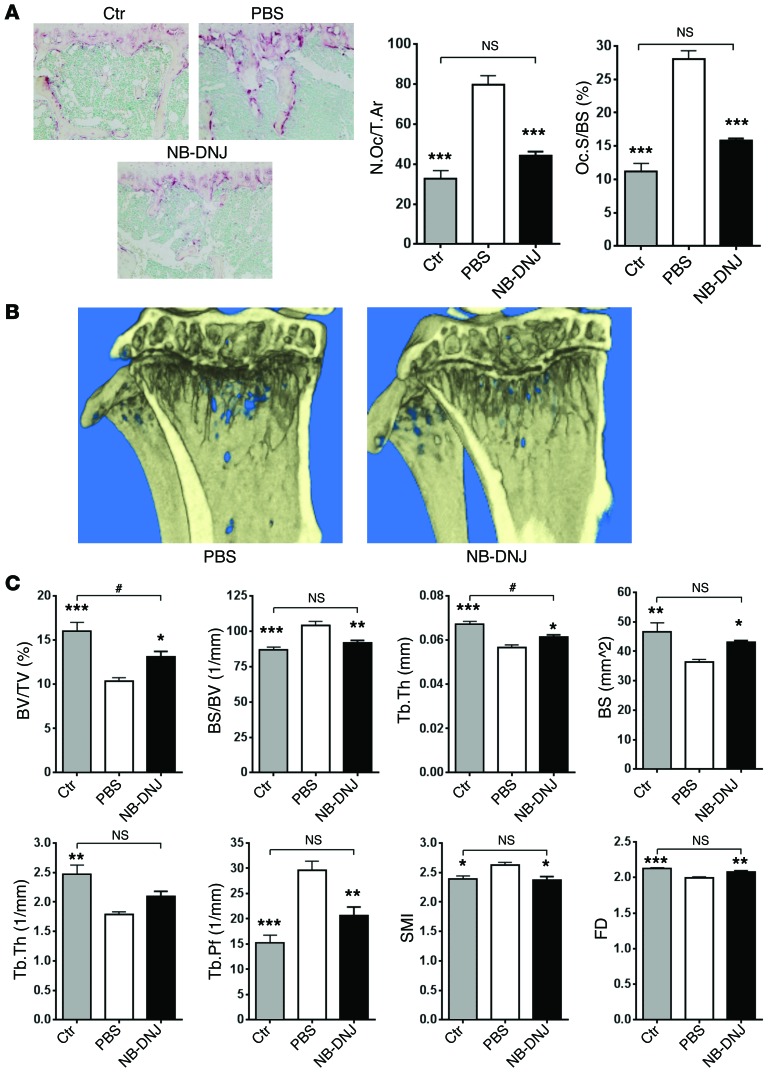
Figure 8. NB-DNJ effectively inhibits 5TGM1 myeloma cell–caused bone lesions in C57BL/KaLwRijHsd mice.
(A) Representative histological sections of TRAP-stained naive control (Ctr), myeloma-diseased and PBS-treated, or myeloma-diseased and NB-DNJ–treated (2,500 mg/kg/d) mouse tibiae (original magnification, ×20) and tibial histomorphometric evaluation: number of OCs reported to total area (N.Oc/T.Ar) and OC surface reported to bone surface (Oc.S/BS). (B) Longitudinal cross section of diseased and PBS- or NB-DNJ–treated (2,500 mg/kg/d) mouse tibiae evaluated by micro-CT reconstruction. (C) Micro-CT analysis parameters of tibiae: BV/TV, BS/BV, Tb.Th, bone surface (BS), Tb.N, Tb.Pf, SMI, and fractal dimension (FD). n = 6 mice/treatment; *P < 0.05, **P < 0.01, ***P < 0.001 versus 5GTM1 cell–transplanted and PBS-treated mice; #P < 0.05 versus non-transplanted naive controls. Error bars correspond to SEM. Statistical analysis was performed using one-way ANOVA followed by Tukey’s multiple comparisons test.

