
Figure 5.
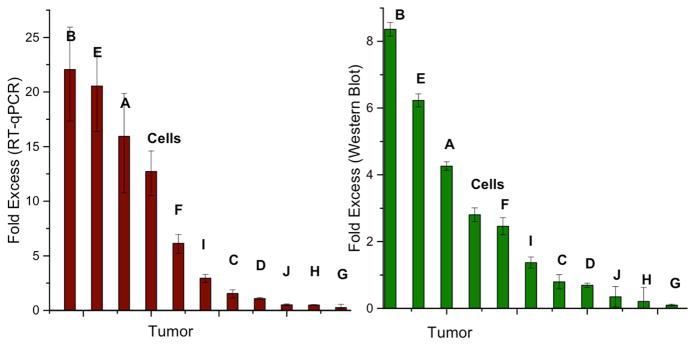
DNMT1 expression and DNMT1 protein quantification. The fold excess DNMT1 expression is determined with RT-qPCR (left), which shows just as many samples with overexpression of DNMT1 in the tumor (fold excess > 1) as with equivalent expression (fold excess ~1) and underexpression (fold excess < 1). The RT-qPCR expression data for DNMT1 expression in the tumor tissue are normalized to that of the normal adjacent tissue. The error represents the standard error across four replicates. The DNMT1 protein content (right), determined by Western blot, follows the same trend as the fold excess DNMT1 expression; overexpression in the tumor sample correlates to more protein in that sample as compared to the normal adjacent tissue. The same trends are observed for those samples with equivalent expression and underexpression. For DNMT1 protein quantification, the measured intensity of the DNMT1 band is normalized to the Lamin A loading control, and subsequently, data for the tumor tissue are normalized to the normal adjacent tissue. Error bars represent standard error across four sets of Western blots. Sample bands used for quantification are shown in Figure S3. Each of the letters represents one of the tumor and healthy adjacent tissue sets, and the bar denoted ‘cells’ represents the result from the comparison between HCT116 colorectal carcinoma and healthy CCD-18Co cultured cells.