
FIG 5.
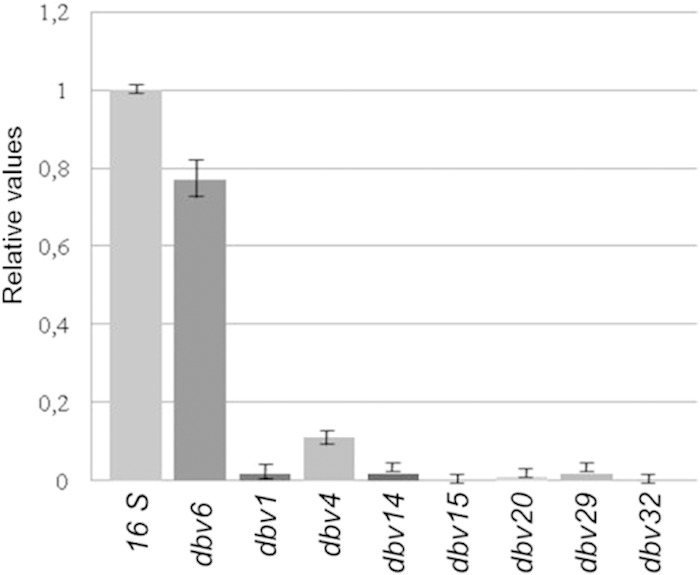
qRT-PCR of selected dbv genes in the Δdbv3 mutant after 60 h of growth. The transcription levels in the mutant were compared to those of the parental strain, taken as 1.0. The standard deviations (indicated by error bars) were calculated from three independent qRT-PCR experiments. The values were normalized using an endogenous 16S rRNA gene.