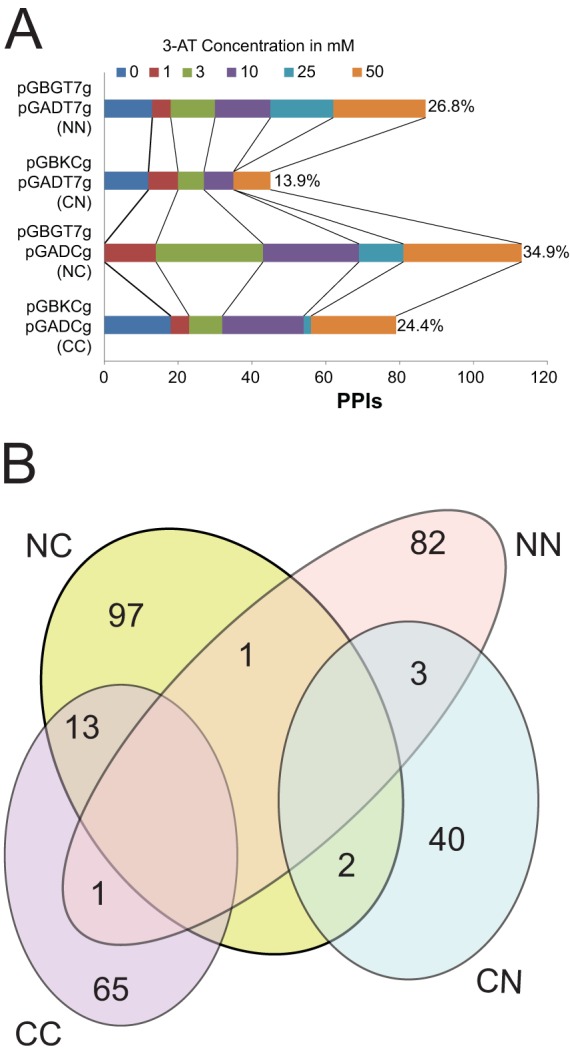
FIG 2.

(A) Differences between Y2H vectors in dissecting the Giles interactome. The total number of PPIs detected by each vector pair at different 3-AT concentrations is shown. Percentages represent the contribution of each vector pair to the Giles interactome. (B) Reproducible PPIs detected by different Y2H vector combinations (CC, CN, NN, and NC). Note that 20 interactions are redundant in this Venn diagram.
