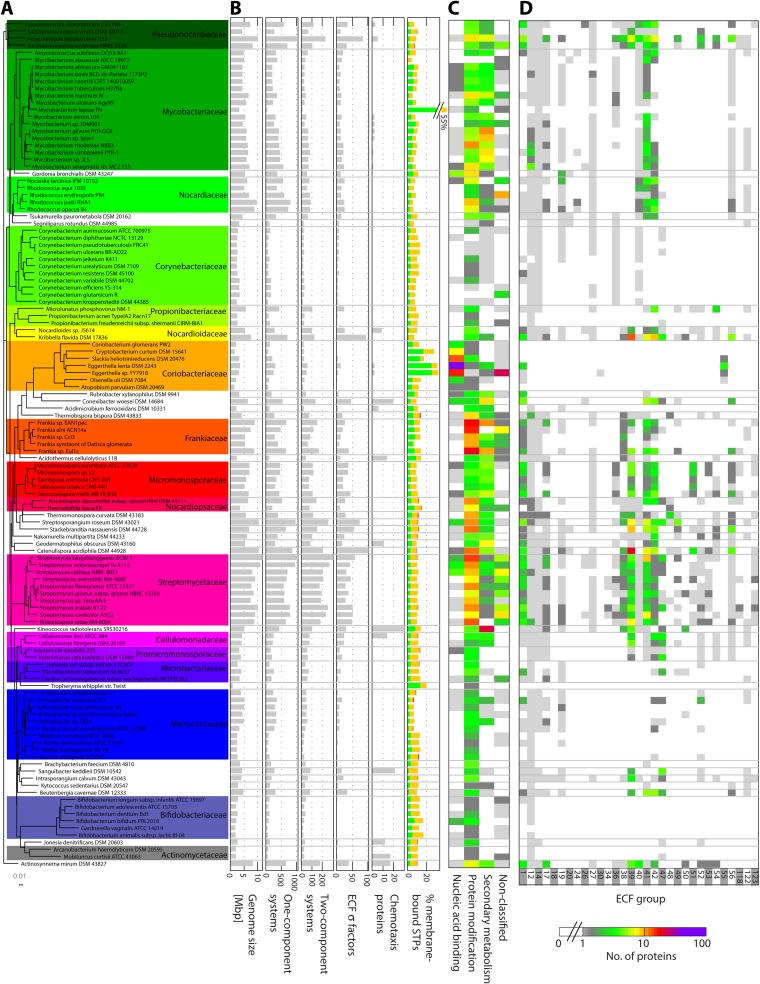
FIG 1.
Distribution pattern of STPs in the phylum Actinobacteria. (A) Phylogenetic tree (based on 16S rRNA) of all the organisms analyzed here. The names of the families represented in our collection by more than one genome are shown on the right in a larger font. Each family is color coded. (B) Distributions of genome sizes and each type of STP by organism. For the percentage of membrane-bound STPs, the color codes for the type of STP is as follows: 1CSs, green; 2CSs, orange; and ECFs, red. (C) The distribution of 1CSs is illustrated by a two-dimensional heat map, where the colors indicate the number of 1CSs of a given type in a given genome. (D) The distribution of ECFs into groups is also illustrated by a two-dimensional heat map, where the colors indicate ECF numbers. The color code is the same as for panel C and is shown below. For clarity, only ECF groups containing more than 10 proteins are shown.

