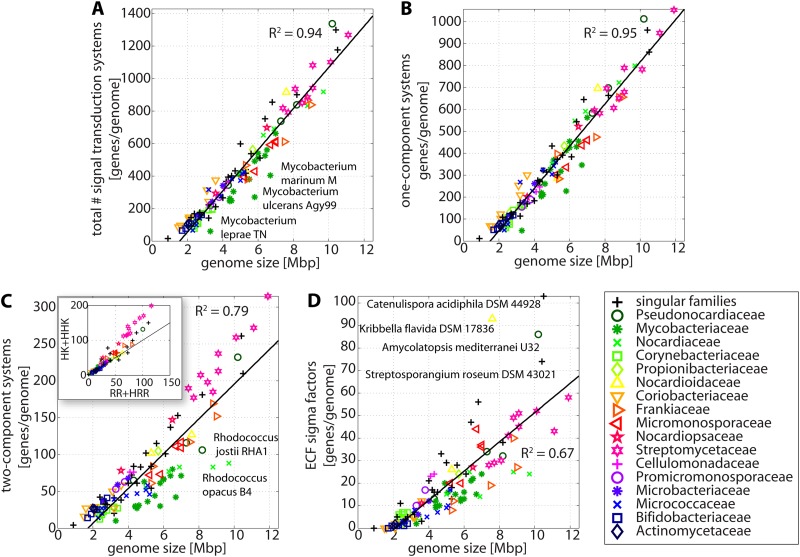
FIG 2.
Correlation of STP numbers with genome sizes. Shown are scatter plots of the total numbers of STPs (A), 1CSs (B), 2CSs (C), and ECFs (D) encoded in a given genome as a function of the organism's genome size. The inset in panel C shows the correlation between HKs and RRs. In all cases, the total numbers of proteins are represented, and the genomes are color coded by taxonomical family. The black lines represent the best fit of a linear equation, and the points that deviate the most from that line are identified by the organism's name. In all panels, the size of the symbol is proportional to the organism's genome size.

