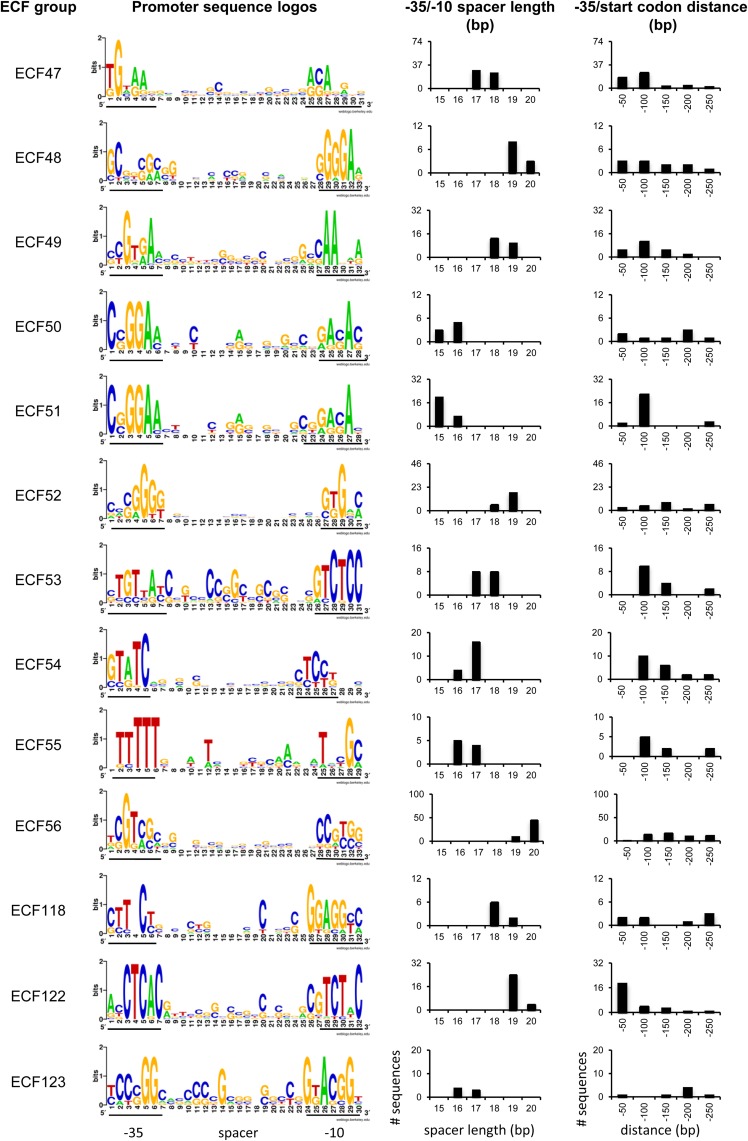
FIG 7.
Putative ECF target promoters. Shown are sequence logos illustrating the −35 and −10 motifs, as well as the corresponding spacer sequences. The exact motifs identified by BioProspector are underlined beneath each logo. The bar charts represent the distributions of spacer lengths found in the identified promoters and the distance between the most upstream residue of the −35 motif and the start codon. The categories are as follows: −50, distances between 0 and −50; −100, distances between −51 and −100; −150, distances between −101 and −150; −200, distances between −151 and −200; −250, distances between −201 and −250. Target promoters were predicted only for groups containing more than 10 proteins and whose putative target promoter motifs were not identified previously.

