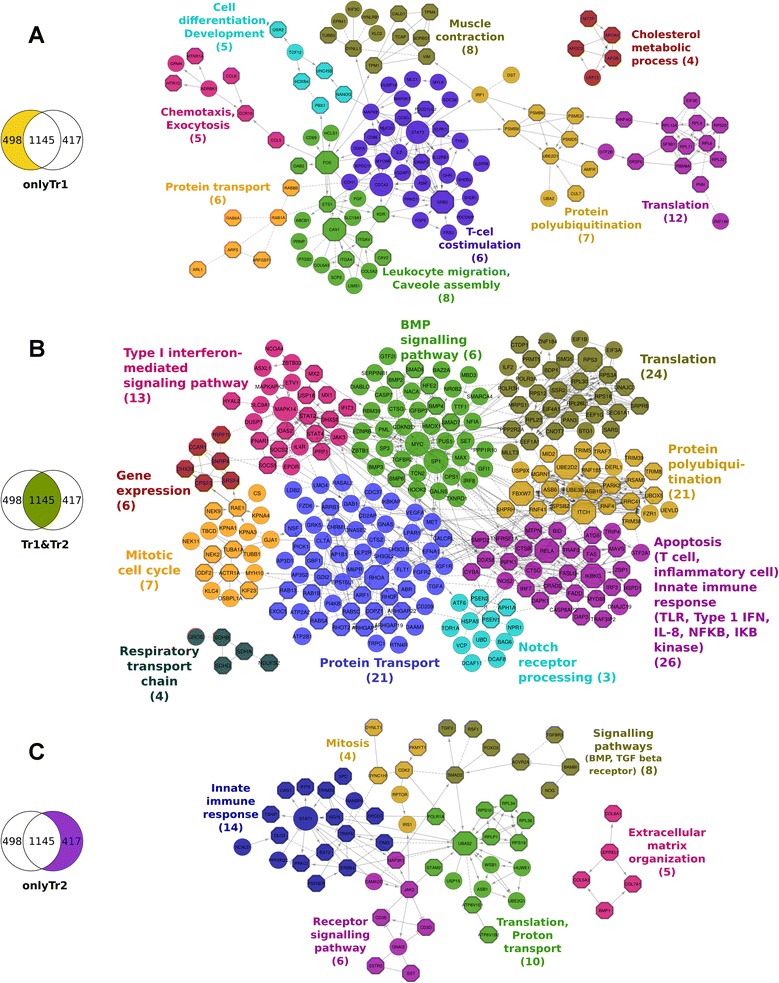
Fig. 2.

Functional Interaction networks (a, b, c). Genes are represented as nodes in the networks, all these genes have time profiles that are significantly different in the treatment than in the control. The edges represent interactions between genes as determined by Reactome. Arrows represent directed interactions, bar-headed arrows indicate inhibition reactions. Dotted lines indicate predicted relationships. Network A was built from OnlyTr1 genes, network B from the common or overlapping genes (Tr1&Tr2) and network C from OnlyTr2 genes. Colours in the network represent the network segmentation into modules. The text denotes the GO term that was most enriched for the genes in that module and the number in brackets denotes the number of genes associated with that particular GO term. Octagonal nodes are related to the GO term at the set p-value threshold. The nodes with a larger diameter are hubs in the networks. High resolution images of the individual networks are given as Additional file 5: Figure S5, Additional file 6: Figure S6 and Additional file 7: Figure S7. The nodes of the Tr1&Tr2 network were rearranged for better visualisation of the modules; the network in the original structure is in Additional file 8: Fig. 4 Additional file 9: Fig. 5
