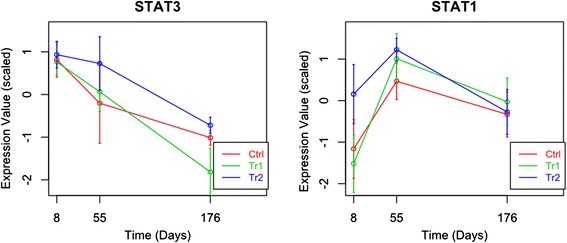
Fig. 3.

Gene expression patterns of important hubs. In Fig. 3 each graph depicts the temporal expression pattern of a single gene. These temporal changes are shown under three different conditions: Ctrl (red line), Tr1 (green line), and Tr2 (blue line). The x-axis indicates the time in days. The expression values (y-axis) are scaled such that the average expression of each gene is 0 and the standard deviation is 1
