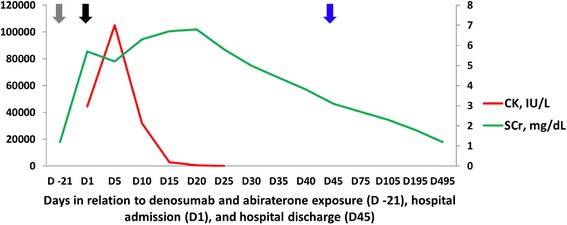
Fig. 1.

Time-related serum creatinine (SCr) and creatine kinase (CK) changes in relation to denosumab and abiraterone exposure (D −21), hospital admission (D1), and hospital discharge (D45). Gray arrow = denosumab 120 mg subcutaneous injection (single shot) and abiraterone started at 1 g orally per day. Black arrow = admission to the hospital, abiraterone stopped. Blue arrow = hospital discharge
