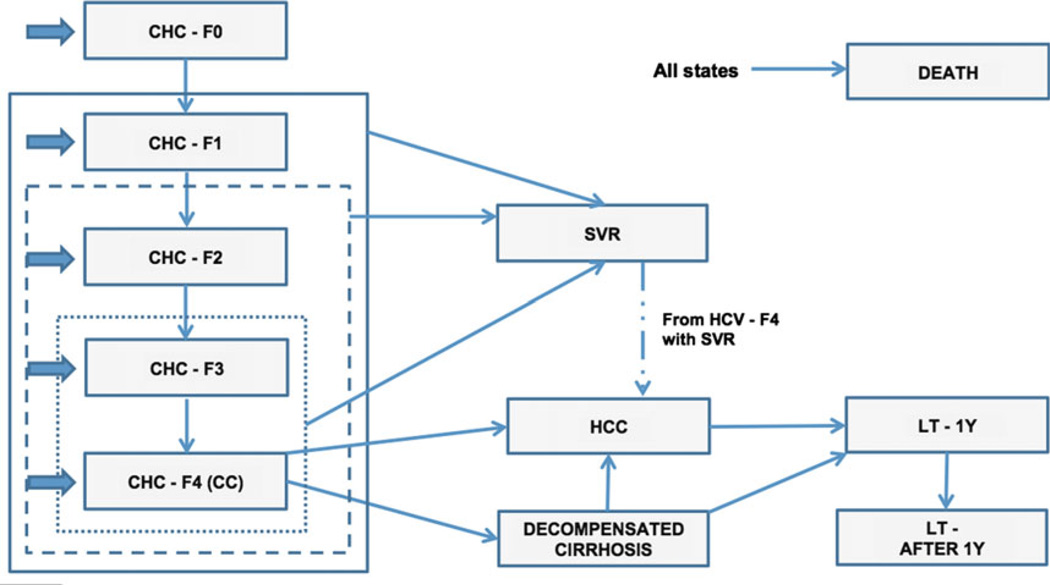
Fig. 1.
Diagrammatic representation of the Markov model. The states of the model are represented by the rectangles, transitions between states are denoted by the thin arrows, and entry points were denoted by large arrows. The continuous line represents the F1–F4 selection strategy, the dash line the F2–F4 and the dotted line the F3–F4.

