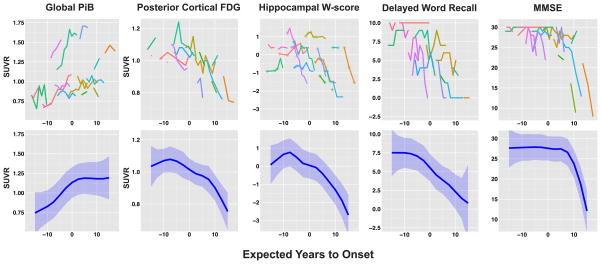
Figure 1. Raw data and estimated group trajectories of neuroimaging and clinical markers.
Raw data for each neuroimaging and clinical marker is plotted against EYO (top row). Each contiguous colored line represents longitudinal data from a single participant. Raw data is being presented without smoothing or jitter as all participants are aware of their mutation status. The estimated trajectory and 99% CI from the mixed models (blue line + blue shaded area) are plotted against EYO for each marker (bottom row). For the hippocampal W-score trajectories, open diamond markers were used to indicate measurements acquired on the 1·5T scanner. A regression correction function had been applied to these measurements to correct for scanner differences.

